
https://www.youtube.com/watch?v=VX_M3tIyiYk
2024-02-21 06:31:22
Power Analysis, Clearly Explained!!!
Stat quest is cool Stat quest .
Hello , I'm Josh Starman .
Welcome to Stag Quest .
Today , we're going to talk about power analysis and it's going to be clearly explained .
Note , this stack quest assumes that you are already familiar with what power means .
If not check out the quest , it would also be helpful if you understood the difference between population parameters and estimated population parameters .
If not check out the quest lastly , because we do a power analysis to avoid P hacking .
You should be familiar with that topic as well .
Imagine there was a virus and we had two drugs that we could use to treat it .
So we see how long it takes for three people using drug A to recover from the virus .
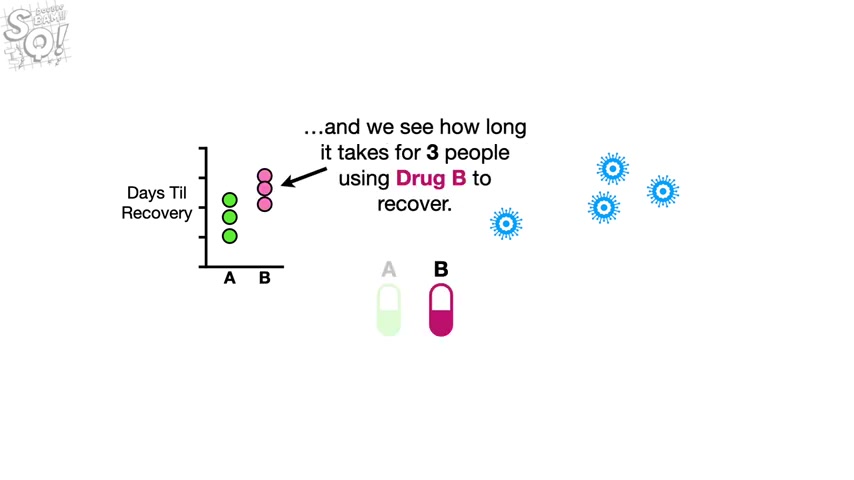
And we see how long it takes three people using drug B to recover .
Just looking at the data makes us think that drug A might be better since those people tended to recover from the virus more quickly .
So we calculate the means for both drugs and do a statistical test to compare the means and get A P value equal to 0.06 WW because the P value is greater than 0.05 .
The threshold that we are using to define a statistically significant difference .
We can't say that drug A is better than drug B .
In other words , even though we suspect that the measurements for drug A represent this distribution and the measurements for drug B represent this other separate distribution because the P value 0.06 is greater than 0.05 .
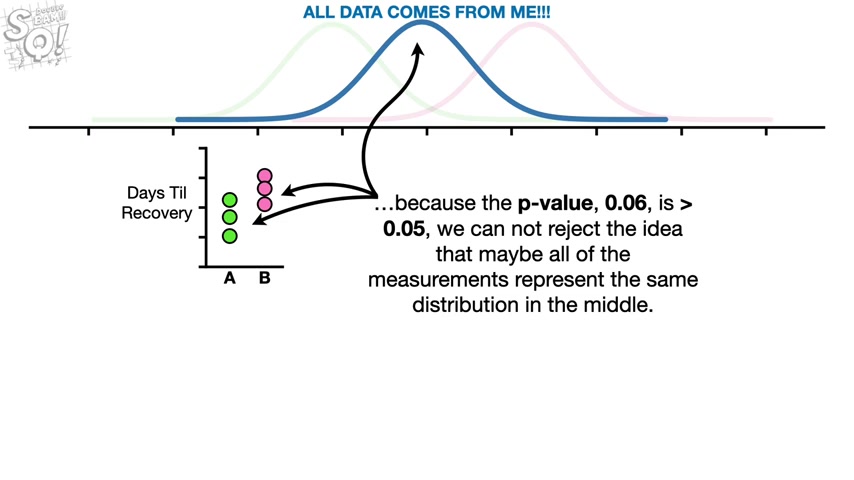
We cannot reject the idea that maybe all of the measurements represent the same distribution in the middle because we suspect that the measurements represent two different distributions .
And the P value 0.06 is just a little bit bigger than 0.05 .
It is tempting to give one more person drug A and give another person drug B and recalculate the means and then redo the statistical test .
However , we must resist this temptation because that would be P hacking .
And we don't want to do that instead of P hacking .
We're going to do the right thing .
We're going to do a power analysis to determine the sample size for the next time we do this experiment .
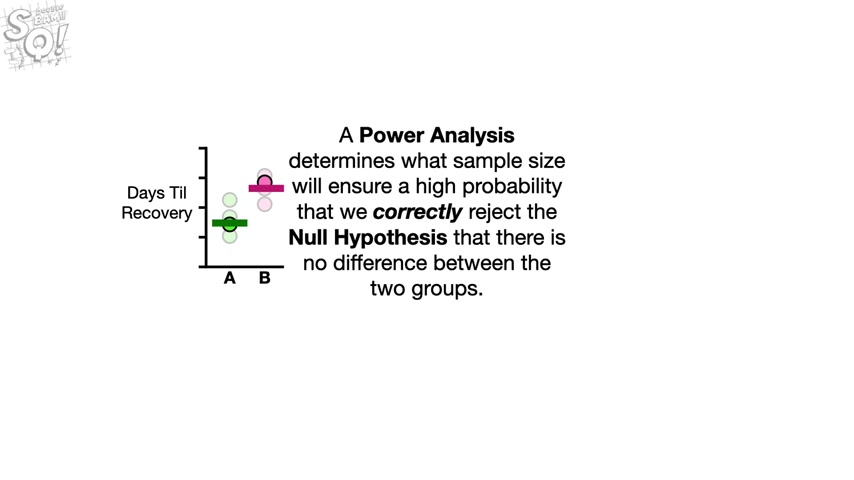
A power analysis determines what sample size will ensure a high probability that we will correctly reject the null hypothesis that there is no difference between the two groups .
In other words , if we use the sample size recommended by the power analysis , we will know that regardless of the P value , we used enough data to make a good decision .
Power is affected by several things .
However , there are two main factors .
One , how much overlap there is between the two distributions .
We want to identify with our study two , the sample size , the number of measurements we collect from each group .
For example , if I want to have power equal to 0.8 meaning I want to have at least an 80% chance of correctly rejecting the null hypothesis .
Then if there is very little overlap , a small sample size will give me power equal to 0.8 .
However , the more overlap there is between the two distributions .
The larger the sample size needs to be in order to have power equal to 0.8 to understand the relationship between overlap and sample size .
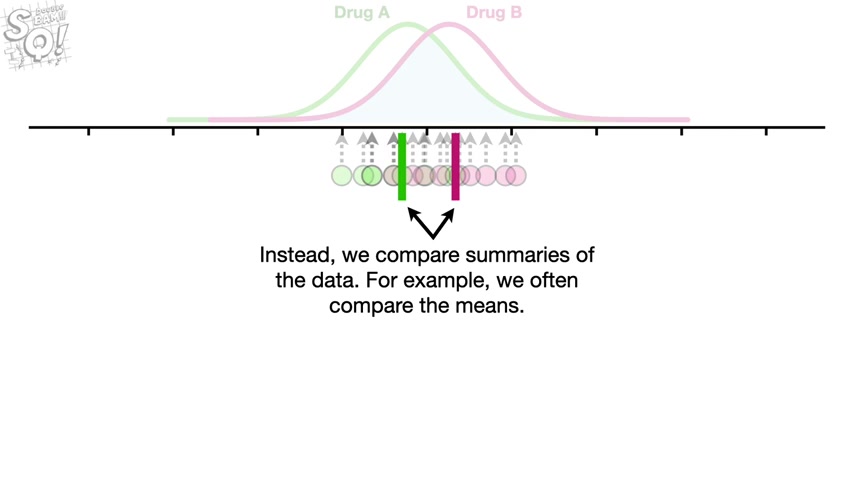
The first thing we need to realize is that when we do a statistical test , we usually don't compare the individual measurements .
Instead we compare summaries of the data .
For example , we often compare the mains .
So let's see what happens when we calculate means with different sample sizes .
First , let's focus on the distribution for drug A , the population mean for drug A is represented by this green arrow .
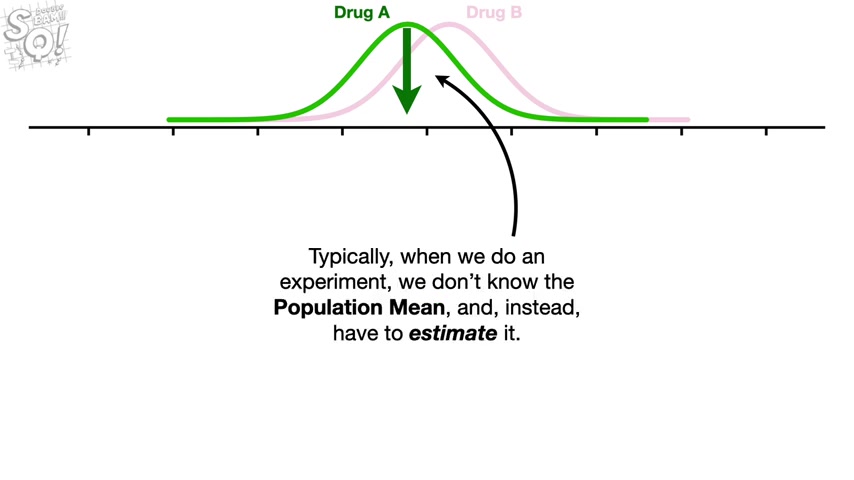
Typically when we do an experiment , we don't know the population mean and instead have to estimate it .
So if we collected one measurement and use that one measurement to estimate the population mean for drug A , then the estimated mean represented by this green bar would be the same as the measurement we collected .
Now let's get rid of the measurement , but keep the estimated mean and collect a new measurement and use it to estimate the population mean .
Now let's collect more measurements and use each one to estimate the population mean .
Note , we occasionally get a wonky point that is really far from the population maine .
And when that happens , the estimated mean is also pretty wonky and really far from the population mean .
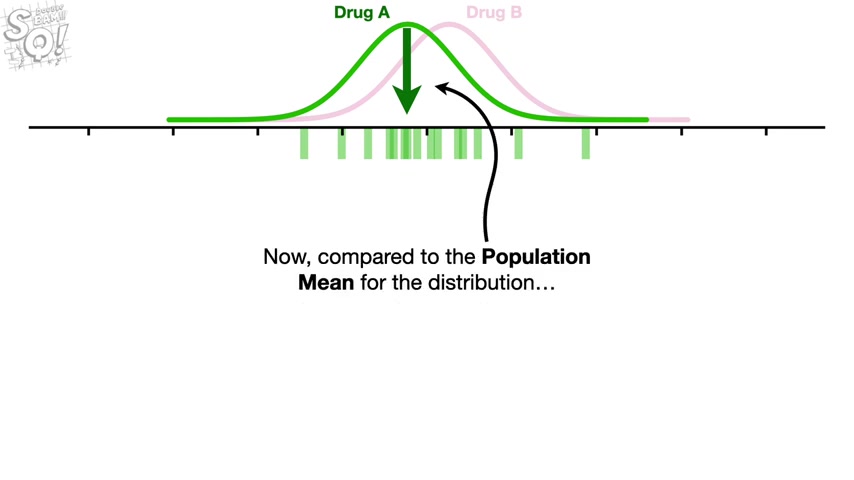
Now , compared to the population mean for the distribution , we see that the estimated means are all over the place .
In other words , there's a lot of variation in the estimated means and all this variation makes it hard to be confident that any single estimated mean is a good estimate of the population mean .
Sure , some of the estimated means are close to the population mean , but others are pretty far away .
And since 25% of the area under the curve is relatively far from the mean and off to the left , 25% of the measurements should be far from the mean and off to the left .
And since in this case , a single measurement is the same as the estimated mean , 25% of the estimated means should be pretty far off to the left .
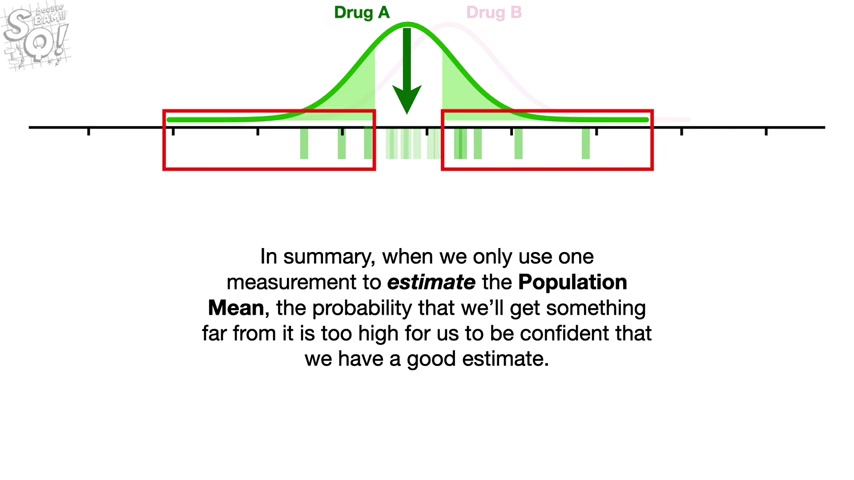
Likewise , another 25% of the estimated means should be pretty far off to the right .
In summary , when we only use one measurement to estimate the population mean , the probability that we'll get something far from it is too high for us to be confident that we have a good estimate .
Now , let's do the same thing for drug B collect one measurement and use that to estimate the population mean .
Now let's do that a bunch of times just like before compared to the population mean for the distribution .
The estimated means are all over the place and just like before , 50% of the estimated means should be pretty far to the left or right of the population mean .
And when we only use one measurement to estimate the population mean , the probability that we'll get something far from it is too high for us to be confident in our estimate .
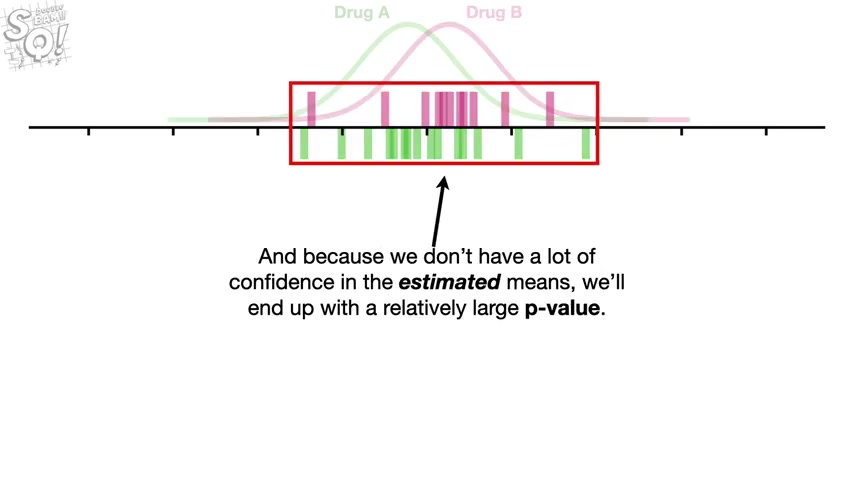
And because we don't have a lot of confidence in the estimated means we'll end up with a relatively large P value .
And that means we will not correctly reject the null hypothesis .
In other words , if this distribution said all data comes from me , then due to all of the variation in the estimated means we'd say in a small meek voice .
Dang , I can't reject the null hypothesis .
Bam .
Now let's collect two measurements at one time and use the average to estimate the population mean .
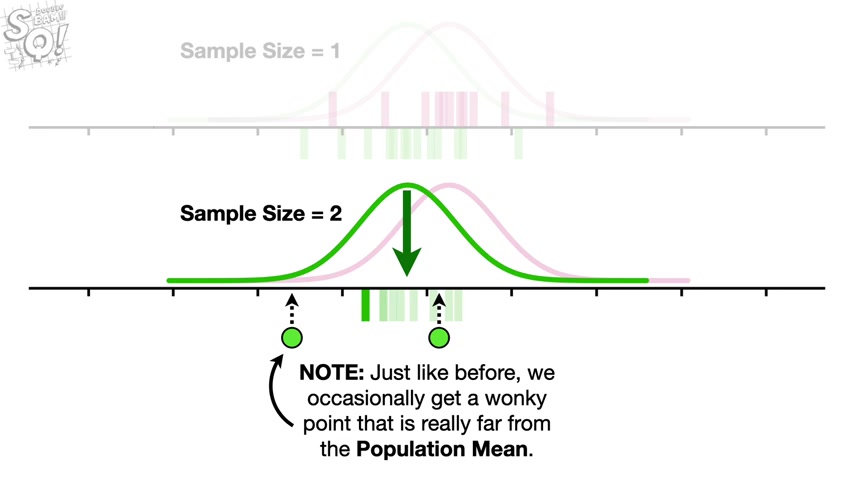
Now let's repeat that process a bunch of times , collect two measurements and use the average to estimate the population mean note just like before we occasionally get a wonky point .
That is really far from the population maine .
However , the other point we measured compensates for the wonky point and prevents the estimated mean from being too far from the population mean .
In other words , even though there is a 25% probability that we will get a measurement way out on the left side , there is a 75% probability that the next measurement will be in this range and pull the estimated mean back to the population mean .
In summary , when we use more than one measurement to estimate the population mean , extreme measurements have less effect on how far the estimated mean is from the population mean .
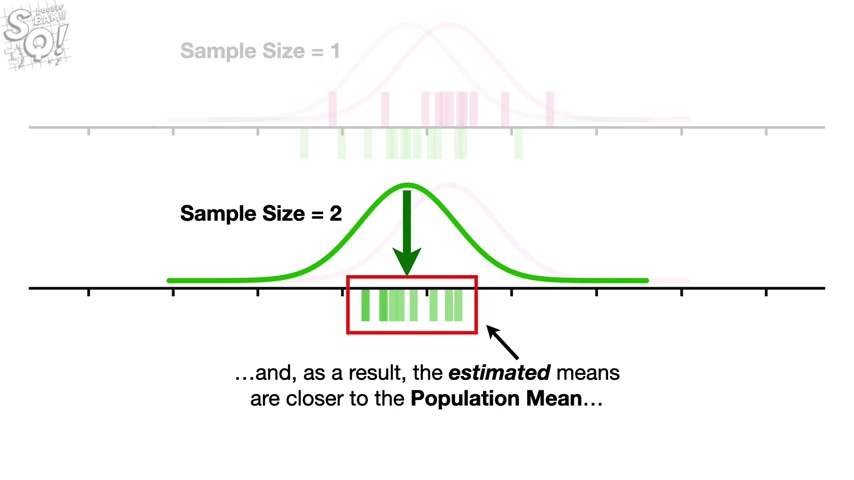
And as a result , the estimated means are closer to the population mean compared to the means we estimated with a single observation .
This suggests that we should have more confidence that averages estimated with two observations will be closer to the population mean than averages estimated with one observation .
Now let's collect two measurements each time for drug B and use their average to estimate the population mean .
Again , when we use two measurements , we can have more confidence that the estimated means are closer to the population mean compared to the means we estimated with a single observation .
Damn .
Now imagine we did the same thing only this time , we collected 10 measurements and use them to estimate the population mean .
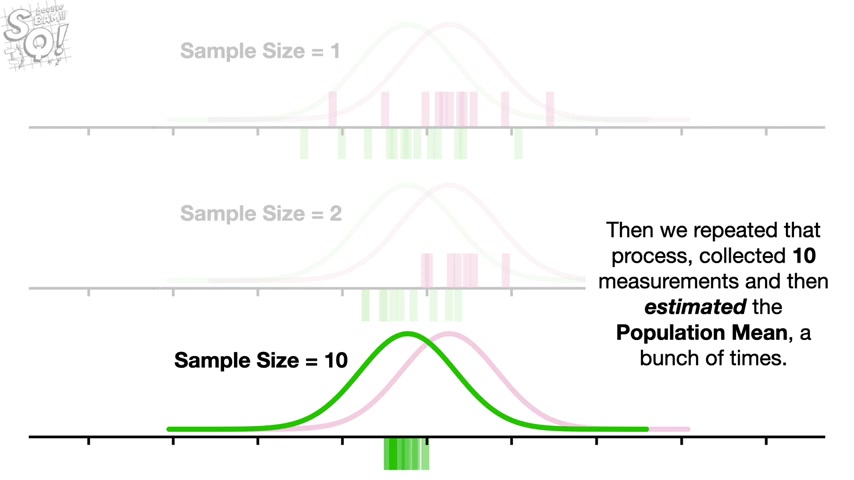
Then we repeated that process , collected 10 measurements and then estimated the population mean a bunch of times then we did the same thing for drug B .
Now we see that the more measurements we use for each estimate , the closer they are to the population Maine and the more confidence we can have that an individual estimated mean will be close to the population mean .
In this example , the estimated means are so close to the population means that they no longer overlap .
And that suggests there is a high probability that we will correctly reject the null hypothesis that both samples were taken from the same distribution .
In other words , even when the distributions overlap , if the sample size is large , we can have high power bam note .
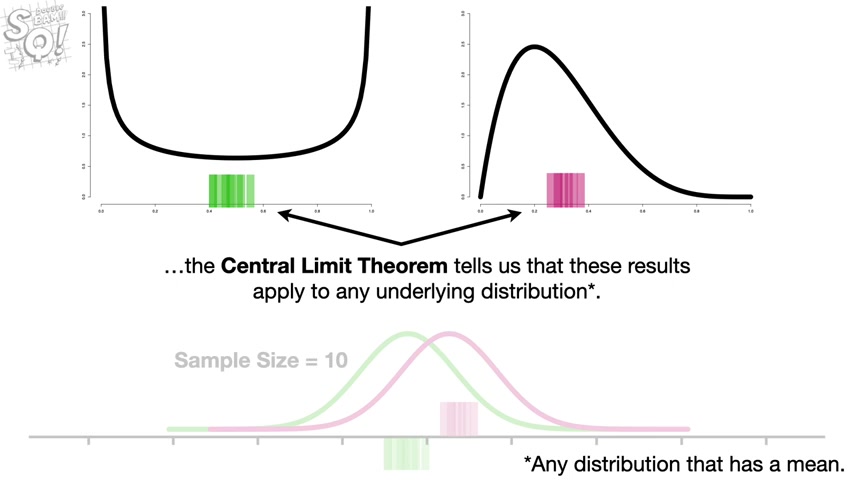
Although we used normal distributions .
In this example , the central limit theorem tells us that these results apply to any underlying distribution , shameless self promotion .
For more details about the central limit theorem , check out the quest .
The link is in the description below .
Now at long last , let's talk about how to actually do a power analysis .
First .
Remember that a power analysis will tell us what sample size we need to have power .
So the first thing we need to decide is how much power we want .
Although we can pick any value between zero and one for power , a common value is 0.8 .
So let's use that , that means we want an 80% probability that we will correctly reject the null hypothesis .
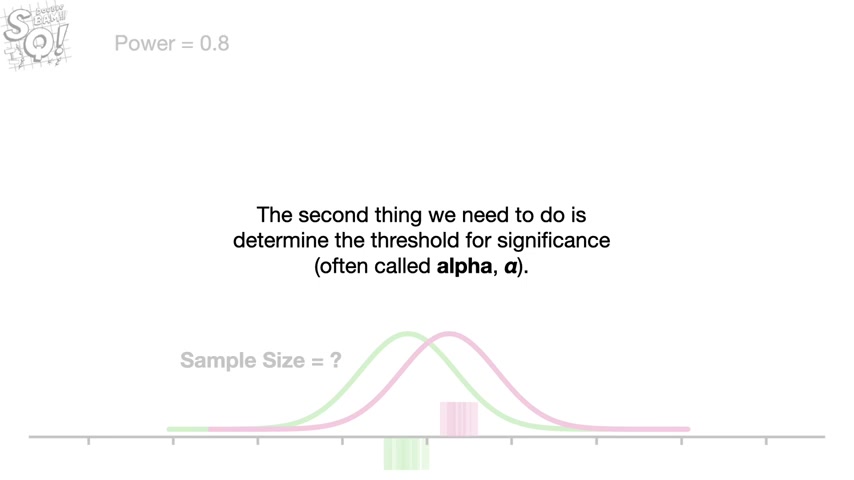
The second thing we need to do is determine the threshold for significance , often called alpha .
We can use any value between zero and one , but a very common threshold is 0.05 .
So we'll use that .
Lastly , we need to estimate the overlap between the two distributions overlap is affected by both the distance between the population means .
And the standard deviations .
A common way to combine the distance between the means and the standard deviations into a single metric is to calculate an effect size , which is also called D .
In the numerator , we have the estimated difference in the means .
And in the denominator , we have the pooled estimated standard deviations .
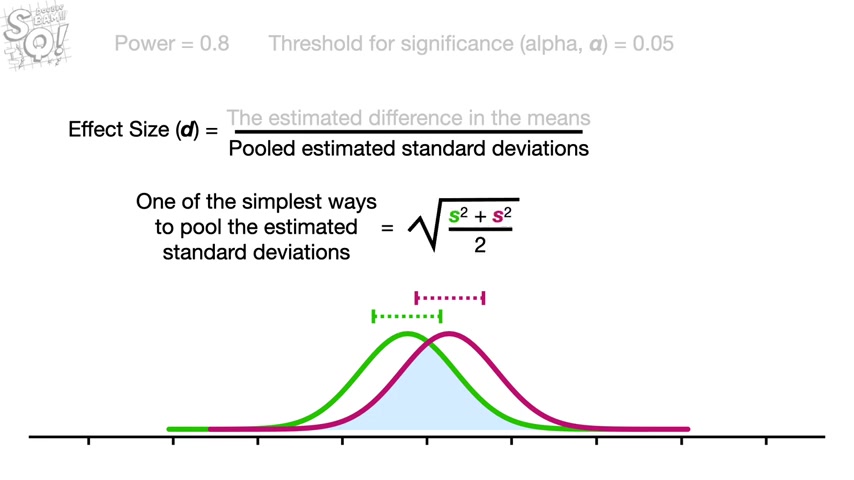
One of the simplest ways to pool the estimated standard deviations is the square root of the sum of the squared standard deviations divided by two where the green s represents the estimated standard deviation for the green distribution .
And the purple S represents the estimated standard deviation for the purple distribution .
Note , there are tons of other ways to calculate effect sizes and this is just one of them .
So when you do a power analysis , you may have to do a little research about how to estimate the overlap .
However , in general , the mean and standard deviations can be estimated with prior data .
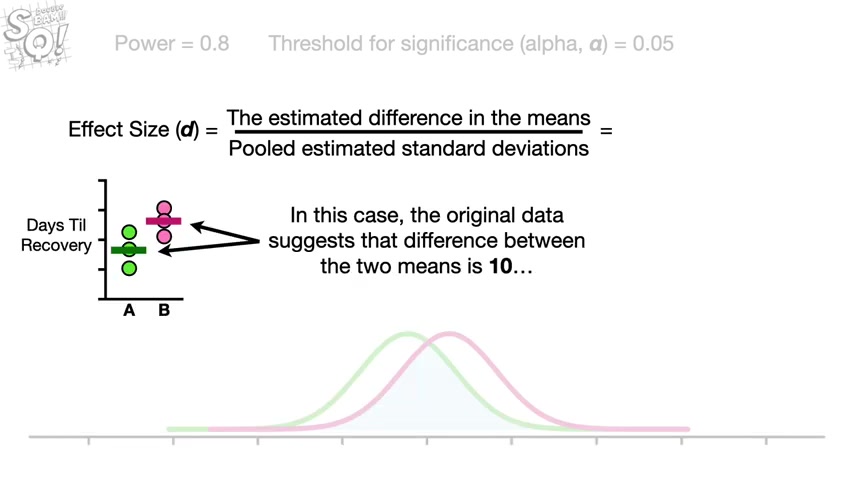
A literature search or in a worst case scenario , an educated guess in this case , the original data suggests that the difference between the two means is 10 and the estimated standard deviations are seven and six .
So we plug those into the formula for the pooled standard deviation and we get 6.5 .
So the effect size is 1.5 .
Once we know the effect size and the amount of power we want and the threshold for significance , we Google statistics power calculator .
Pretty much every statistics department in the world has one online .
Then we plug in the numbers .
I got sample size equals nine .
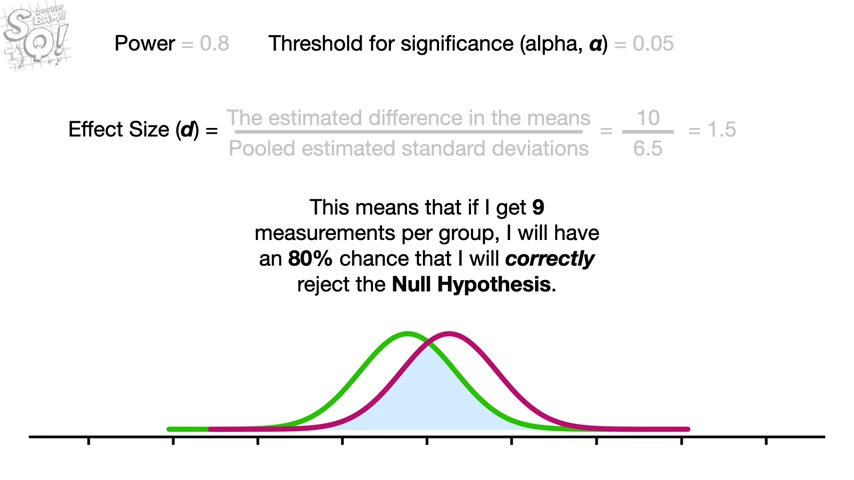
This means that if I get nine measurements per group , I will have an 80% chance that I will correctly reject the null hypothesis .
Double bam .
In summary , when two distributions overlap , we need a relatively large sample size to have a lot of power .
When the sample size is small , we have low confidence that the estimated means are close to the population means .
And that lack of confidence is reflected in a low probability that we will correctly reject the null hypothesis .
In contrast , when we increase the sample size , we have more confidence that the estimated means are close to the population means because extreme observations have less effect on the location of the estimated means .
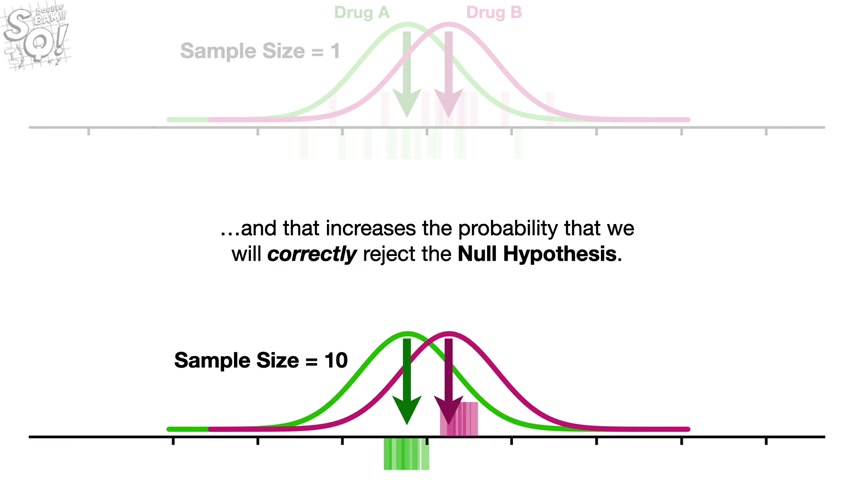
And the closer the estimated means are to the population means , the less the means from the different distributions will overlap and that increases the probability that we will correctly reject the null hypothesis .
And when you have a high probability that we will correctly reject the null hypothesis , you have high power .
Triple bam hooray , we've made it to the end of another exciting stack quest .
If you like this stack quest and want to see more , please subscribe .
And if you want to support stack quest , consider contributing to my Patreon campaign becoming a channel member , buying one or two of my original songs or a T shirt or a hoodie or just donate .
The links are in the description below .
All right .
Until next time quest on .
Original video
Partnership
Are you looking for a way to reach a wider audience and get more views on your videos?
Our innovative video to text transcribing service can help you do just that.
We provide accurate transcriptions of your videos along with visual content that will help you attract new viewers and keep them engaged. Plus, our data analytics and ad campaign tools can help you monetize your content and maximize your revenue.
Let's partner up and take your video content to the next level!
Contact us today to learn more.